I spent a long time examining validation and reliability studies on the Food Frequency Questionnaires (FFQ). It was interesting to compare the original validation studies with a new FFQ that was published in early 2024; researchers asked subjects in those studies that began decades ago to participate in this recent validation study.
The Stats
I learned more about a variety of statistics that I don’t typically encounter: coefficient of correlation, and then attenuated and deattenuated coefficient of correlations, and more. The researchers concluded that the “study showed that the FFQ used in prior studies has reasonably high reproducibility and validity in measuring food and food groups intakes among both women and men.” I disagree.
The coefficient of correlation is important (COC) because it gives an indication of the association of the variable with a standard, in this case a 7 Day Dietary Recall. The best COC is 1.0 or -1.0, which means it’s perfectly correlated or not correlated with the standard. A COC greater than 0.8 is considered a strong relationship, but a relationship of 0.6 – 0.79 is considered moderate.
The COC for most categories of food was well below 0.6. How can that in any way be valid? It may be reproduceable, but you’re reproducing the same mistake over and over again.
How Dangerous Is Meat?
High level analytics like this aren’t my area of expertise, but logic dictates that you can’t get precision even with large numbers of subjects. This is especially true when using FFQ data to correlate nutrition with disease. Remember the study on red meat intake and type 2 diabetes? The Hazard Ratio was only 10% per 100-gram serving of red meat. If the meat intake is moderately correlated, how much does any error of intake impact the HR?
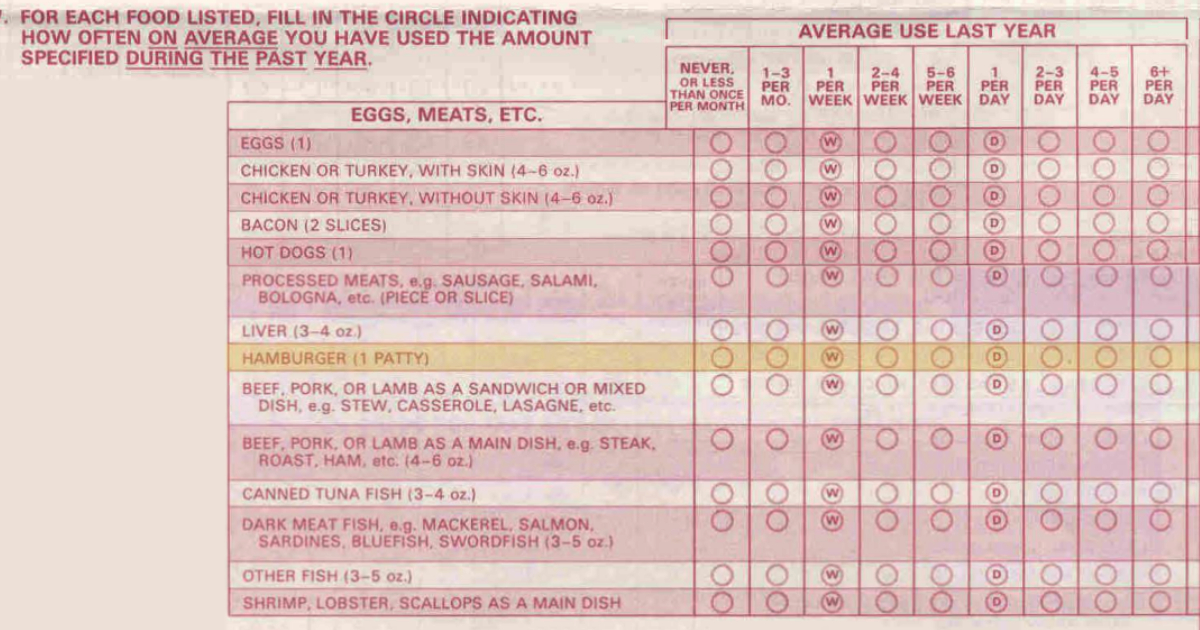
Whether researchers are trying to estimate how much of each type of meat a person eats or trying to calculate the heme-iron content of that meat, the FFQ doesn’t have enough precision to be used in determining those values. Remember, the increase in HR was 10% per 100 grams—that’s 3.3 ounces—of unprocessed red meat per day. If a patty were 100 grams, a reasonable size, and you ate six patties every day, that would be 600 grams or over 1.5 pounds of hamburger patties per day. Would that raise the HR to 60% based on that single answer? What about a vegan who gets no heme iron? Would they never get type 2 diabetes? We know that’s not true either.
One more thing: People under-report what they eat. It can be 100 to 200 calories per day, or even up to 500 calories per day. No after-the-fact adjustment of the food intake can make up for that kind of imprecision.
The Bottom Line
What we’re left with is this: There may be a relationship between red meat, and subsequently, heme iron intake, and the risk of type 2 diabetes, but we don’t know how much. That’s about it. We’re going to need much better studies to nail that down before we make a pronouncement. For now, you’re probably safe eating red meat, especially if you keep this in mind: eat better, eat less, and move more.
What are you prepared to do today?
Dr. Chet
References:
1. Am J Epidemiol. 1985;122(1):51–65.
2. Am J Epidemiol. 2024;193(1):170–179